Abstract
Regression is a useful statistical tool for determining relationships between a dependent variable and one or more explanatory variables. Linear regression is often used but is ineffective for datasets where geography plays a significant role. Geographically weighted regression is then a more appropriate method of examining relationships that incorporates a spatial context. I examined factors that most strongly dictate language ability in children in the Metro Vancouver area and performed a series of exploratory regression analyses to identify a set of explanatory variables. Generalized linear regression and geographically weighted regression were then performed and results were compared. Residuals of income and ESL status resulting from the GWR analysis are examined. In addition to this case study, examples of the different applications of GWR are also briefly explored.
Geographically Weighted Regression
Oftentimes we are required to examine relationships between different variables. These relationships can exist in many forms, and one way to identify them is through the use of statistical analysis. One popular method of study is regression analysis. Simply stated, regression examines the extent to which an independent variable explains a dependent variable. Because the world is complex, we can generally expect a specific phenomenon to be explained by multiple factors. In the event where we must examine the relationships between our dependent variable and multiple explanatory variables, we are able to use regression in the form of a multiple regression analysis.
There are many derivations of multiple regression. In this study, we use two different types of regression analysis: generalized linear regression (AKA ordinary least squares) and geographically weighted regression, or GWR for short. When discussing generalized linear regression, most people who are experienced in working with statistics may recognize as ordinary least squares regression. GLR is simply defined as a method to gauge the relationship between a dependent variable and a set of explanatory variables. As a general tool, GLR is effective in presenting statistical relationships. In the case of geographical data however, it falls slightly short with regards to accuracy. The reason for this shortfall is that GLR assumes processes are globally constant and fails to take into consideration the effect that environment has on data.
The solution to this problem comes in the form of GWR, which is the second method of regression analysis that is used in this study. The difference between GWR and GLR is that GWR finds relationships between variables similarly to GLR but it also manages to include the effects of geography. The way GWR implements spatial considerations is by taking each individual point and examining the variables of the neighbouring points in order to make predictions that appropriately indicate the effects of geography. Geographically weighted regression is most useful with spatial datasets that have at least several hundred points in order to paint the clearest picture of how the environment may affect a feature. Additionally, GWR conveniently allows us to examine how each explanatory variable’s effect changes according to location, meaning we are able to see where something like income may have stronger influence in certain areas over others.
Results
The goal of this study was to determine different factors that affect children’s language abilities in Metro Vancouver. Using ESRI’s ArcPro, a series of exploratory regression analyses was conducted to identify the five most significant explanatory variables from a set of potential variables. These were household income, single parent status, rate of recent immigration, sociability, and the child’s status as ESL. The influence of each explanatory variable was then determined using the previously mentioned methods of generalized linear regression and geographically weighted regression.
Examining the numerical results, there is a clear influence that geography plays on the dependent variable that can be identified by one simple principle. The resulting GLR residual coefficients for each variable were constant, while the GWR values existed in a range (Figure 1). This distinction comes from the variables having different effects in different locations. A residual can be briefly defined as being the difference between the observed value at a point and the value predicted by whichever statistical tool is being used. Positive residuals suggest a factor is a positive influence, while a negative value suggests the opposite. To interpret the residuals from GWR, a larger range of values indicates a larger spatial effect and vice-versa. Another effect that spatial considerations have on the data is that predictions come closer to recorded values, and residuals are more moderate across the board, with the differences between the GLR and GWR being most noticeable in the East Vancouver area, where the role of location seems to be more significant than in other regions.
In a further attempt to visualize the importance of spatial context, a spatially constrained multivariate clustering was conducted, which separated Metro Vancouver into 5 distinct regions that were determined through how similar neighbouring points were. The five classifications are as follows:
- High rates of childcare, low income
- High rates of lone parenthood, low rates of recent immigrants (<5yrs)
- Few children, medium income
- High income, immigration rates, and family rates
- Low child and immigration rates and high income
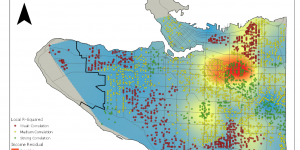
An output boxplot presents a detailed visualization of the general trends that identify each class (Figure 2b). Local r-squared values were then used for each point to determine goodness of fit, meaning how effective GWR was in explaining language scores, and we can identify several pockets of strong correlation in the East Vancouver, Kitsilano, and Dunbar regions. Inversely, there are several ranges of weak correlation where other factors such as predominant land-use may be more relevant (Figure 2a).
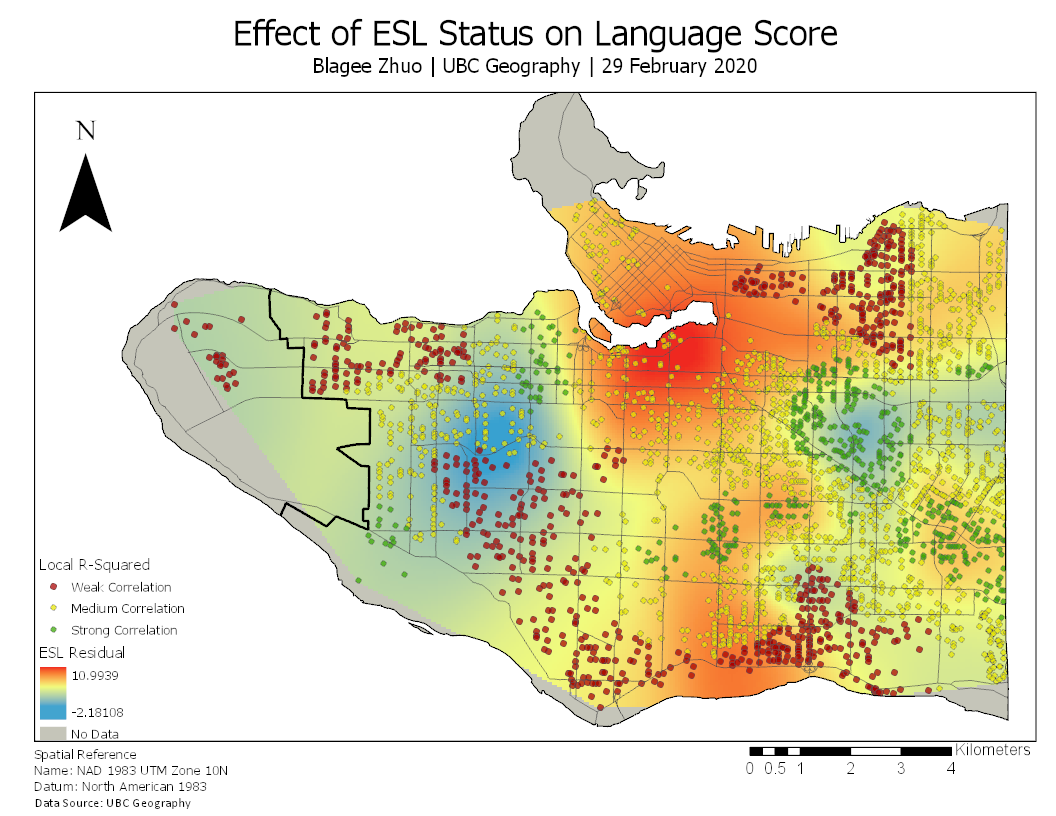
In this study, I focus on examining the effects of income and ESL status on language skills in particular, creating visualizations displaying the effects of the two factors as they vary from a spatial context (Figures 3 and 4). Looking at income, its effect is most noticeable in several warm spots and one large hot spot that all sit in East Vancouver, where income is relatively low (Figure 3). This suggests that as household income increases, change in income plays a reduced role in determining a child’s language skills. Conversely, ESL status seems to have a largely positive correlation with the exception of some cold spots in the West Point Grey area and East Vancouver that may be explained by reasons such as lower population density or cultural homogeneity where the primary language of communication in a neighbourhood is not English (Figure 4).
Discussion
Ultimately, the purpose of this study was to use geographically weighted regression analysis to demonstrate the importance of examining statistics with consideration for geographical and spatial factors. GWR is a powerful tool that can be and has been used in many different contexts, ranging from examining census data like this study has done, to health geography, ecology, and many other disciplines.
Chen et al. use GWR as a tool to help identify socioeconomic factors that determine a population’s exposure to harmful atmospheric particulates, specifically PM2.5 (2018). Their study cites GWR as being “superior to traditional regression models like the ordinary least squares (OLS) because they support the calculation of a parameter estimate of local variations in the association between independent and dependent variables rather than a global regression” (Chen et al., 2018). They also state that though their application of GWR is rare, their results could be beneficial for “policy makers and planners in the mitigation of China’s population’s exposure risk to PM2.5 concentrations” (2018).
In another application that could be categorized under health geography, Boris Kauhl et al. use GWR to “determine local differences of the association between HCV risk and population-based determinants” (2015). As a result of their study, they were able to find that urban areas were HCV hot spots and were also able to identify the most at-risk groups of persons. Similarly to Chen et al., the results of this study can assist in informing the decision-making process and “future targeted interventions” (Kauhl et al. 2015).
Energy and ecology are two topics that where spatial context is vastly important, and topics where GWR is capable of assisting studies in finding meaningful results. In a study by Eiserhardt et al., GWR is used to determine palm species richness in the tropical and sub-tropical Americas using a set of climate variables (2011). Their purpose for the study was to test the hypothesis that the influence of water decreases and influence of energy increases with absolute latitude. In their discussion, GWR is claimed to be efficient when exploring the scale-dependency of relationships but tend to over-fit at small scales which results in inaccurate predictions (2011).
Geography plays a prominent role in many disciplines, and geographically weighted regression analysis is a powerful tool for identifying and studying spatial relationships. As technologies improve and our ability to conduct scientific study at larger scales and finer resolutions, GWR is becoming an increasingly valuable tool in understanding the different relationships that exist and better explaining causes and results.
Works Cited:
Chen, J., Zhou, C., Wang, S., & Hu, J. (2018). Identifying the socioeconomic determinants of population exposure to particulate matter (PM2.5) in China using geographically weighted regression modeling. Environmental Pollution, 241, 494–503. doi: 10.1016/j.envpol.2018.05.083
Eiserhardt, W. L., Bjorholm, S., Jens-Christian Svenning, Rangel, T. F., & Balslev, H. (2011). Testing the Water–Energy theory on american palms (arecaceae) using geographically weighted regression. PLoS One, 6(11) doi:http://dx.doi.org.ezproxy.library.ubc.ca/10.1371/journal.pone.0027027
Kauhl, B., Heil, J., Christian, J. P. A. H., Schweikart, J., Krafft, T., & Nicole, H. T. M. D. (2015). The spatial distribution of hepatitis C virus infections and associated Determinants—An application of a geographically weighted poisson regression for evidence-based screening interventions in hotspots. PLoS One, 10(9) doi:http://dx.doi.org.ezproxy.library.ubc.ca/10.1371/journal.pone.0135656
Appendix
Figure 1. GLR coefficients and GWR residual ranges for each explanatory variable
| Explanatory Variable | GLR Coefficient | GWR Minimum | GWR Maximum |
| Income | 0.086723 | -0.371838 | 2.14084 |
| Recent Immigrant | 0.067444 | -0.212653 | 0.369193 |
| Lone Parent | -0.316155 | -1.79068 | 1.99519 |
| Social Score | 0.621941 | 0.440344 | 0.875059 |
| ESL | 5.451903 | -2.18108 | 10.9939 |
Figure 2a. Household points plotted as local r-squared values over a spatially constrained multivariate cluster map
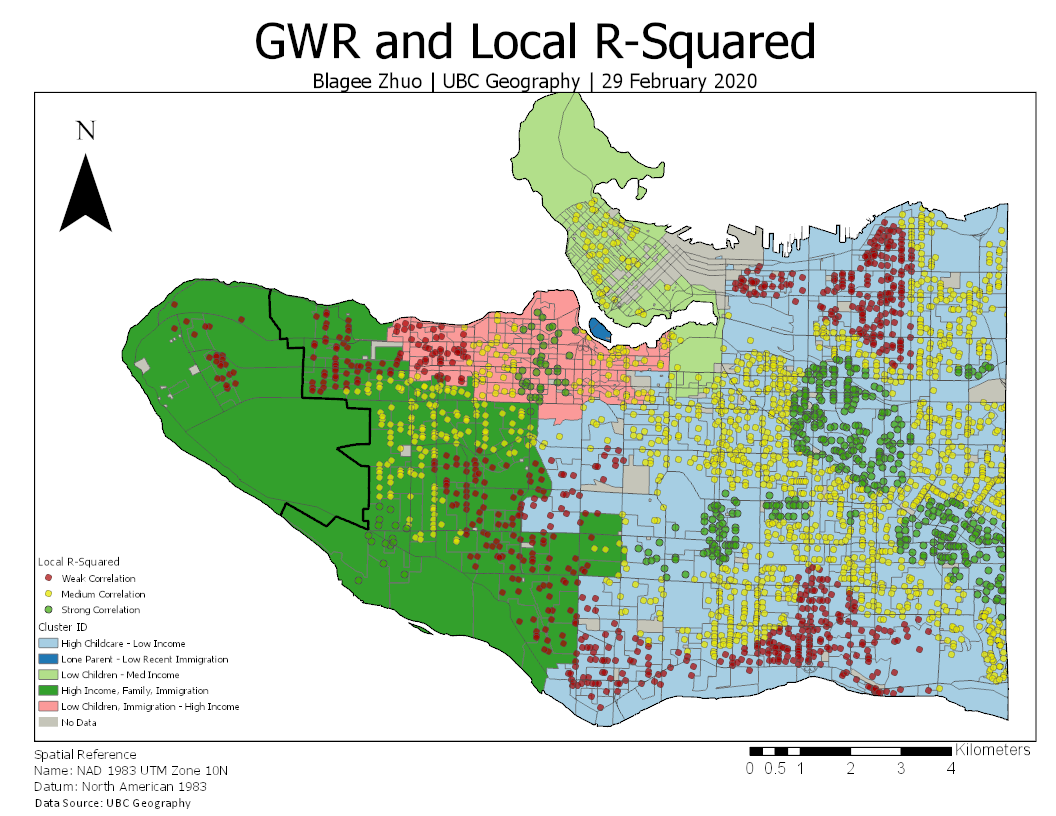
Figure 2b. Resulting boxplot from spatially constrained multivariate clustering.
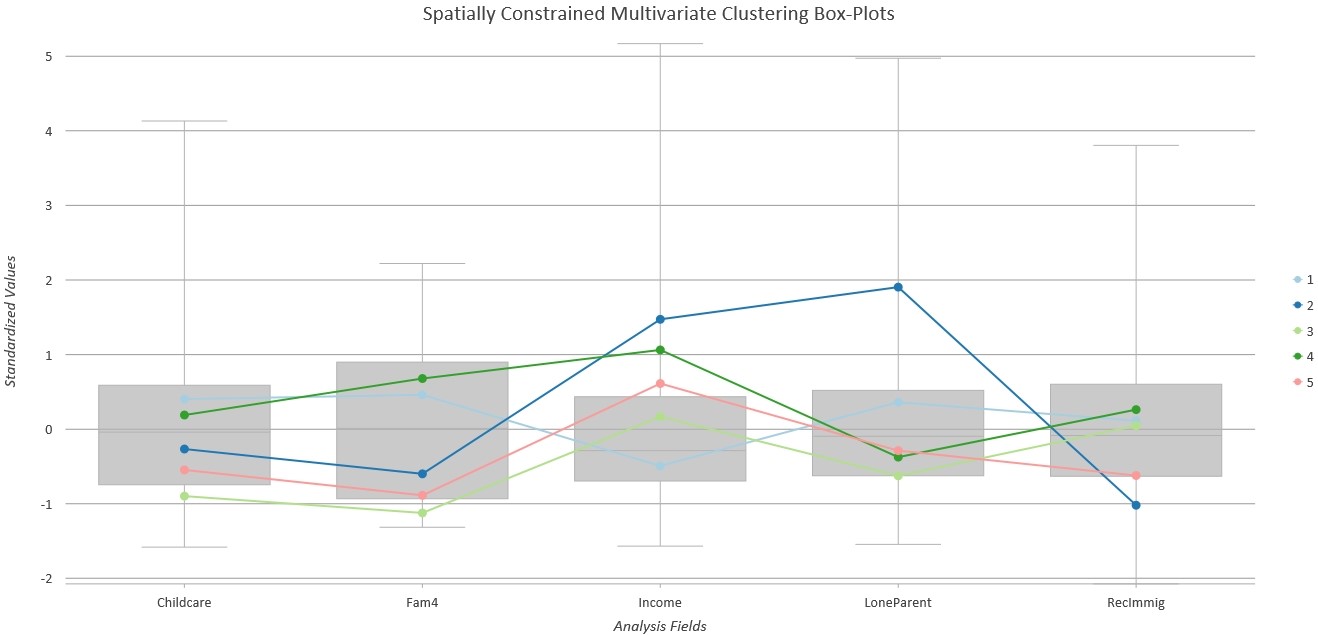
Figure 3. Local r-squared points plotted over GWR output feature of income
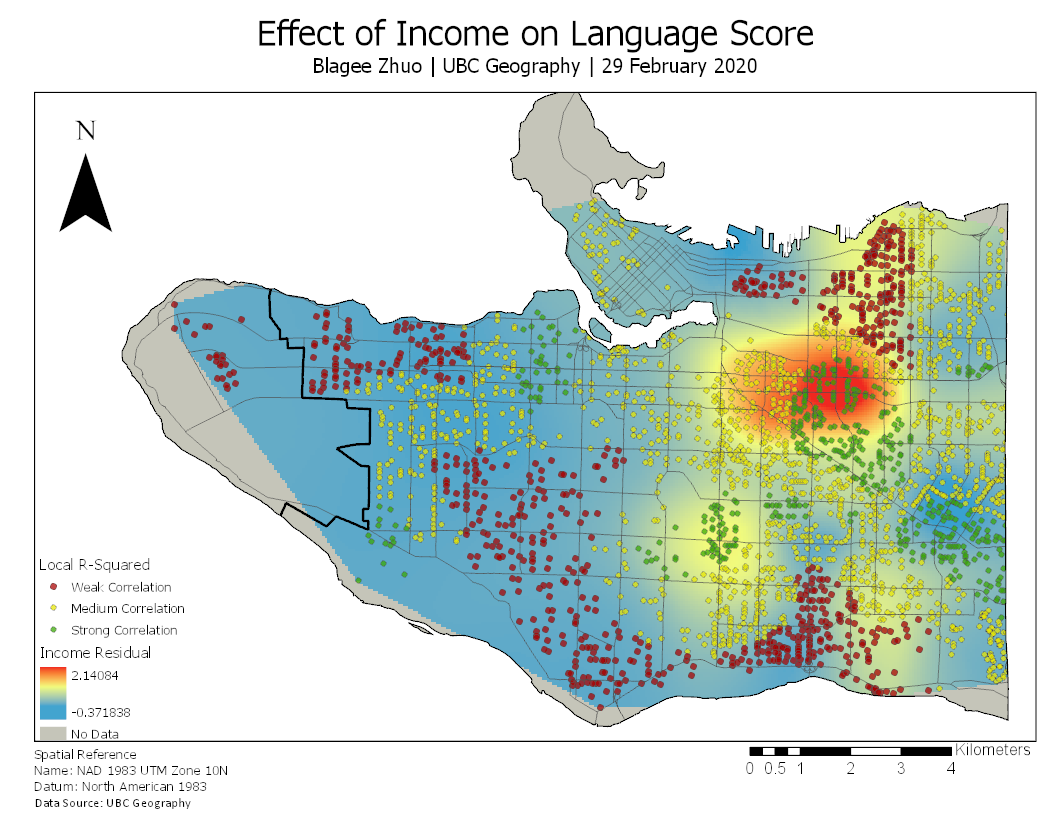
Figure 4. Local r-squared points plotted over ESL status