Executive Summary
As the capital city of Alberta, Edmonton is a major urban center that should be expected to host an abundance of industrial and urban area. As a result of population growth and industrial development between 1966 and 1977, urban built-up area increased by approximately 35,000 hectares, productive woodland increased by 30,000 hectares, and mines, quarries, and sand and gravel pits increased by roughly 1,500 hectares. Inversely, undeveloped land saw dramatic decrease in area across the board. Cropland was reduced by 20,000 hectares, non-productive woodland by 12,000, swampmarsh by 5,000, and unimproved pasture and range land by 30,000 hectares. As the Edmonton Metropolitan Area continues to grow, we urge the municipality to make careful considerations when allocating land for different purposes. Aggressive development can have major consequences that take various forms.
Introduction
To a province reliant on fossil fuels as the primary economic tool, the decision to develop land in the manner most efficient for extracting oil seems undeniably favourable. As the provincial capital of Alberta, the fiscally responsible mindset appears to be as stated above. On the topic of land development, it is prudent to make decisions from a well-informed and well-advised perspective. This report will review the history of land-use change between 1966 and 1976 in the Edmonton Metropolitan Area and examine the effects that arise through variations in the landscape.
Methods
Data for this report was gathered from the GeoGratis archives for Edmonton and the surrounding region. We used Canada Land Use Monitoring (CLUMP) data from 1966 and 1976 in order to create an adequate timeframe to observe changes in land-use through time. The data we used was at a resolution of 100 metres in order to create a finer model to make to accurate observations. Using the data collected, we created a series of maps that visualize the study area and highlight the changes that occurred over the decade of focus (Figure 1, 2, 3). The information was then used to create a transition matrix that indicated how each land type changed in relation to each other (Table 4). Additionally, we inputted the land-use data into the spatial statistics program Fragstats in order to provide sufficient numerical data for comparison. The metrics that were used for analysis are effective in indicating the various forms in which change occurred, especially in the form of rezoning.
Results and Discussion
When examining the data we can see the most prominent class type in the study area is cropland (Figure 1). In 1966 cropland occupied 44.18% of the total landscape which equates to 284,664 hectares in area. A decade later, cropland’s share of the landscape was reduced to 40.86% or 263,105 hectares (Table 2). While still being the dominant class of land, 10 years saw a decrease of roughly 18%, with 6.65% retaining its agricultural purpose in the form of unimproved pasture and range land and 7% being transformed into urban built-up area (Table 4). Although a large amount of cropland was rezoned, land from other class types was also repurposed to become cropland. Most notably, roughly 2,400 hectares of non-productive woodland, 2,800 hectares of productive woodland, 2,000 hectares of swamp/bog, and 19,800 hectares of unimproved pasture and range land became cropland (Table 4). These changes ultimately resulted in a flux of a 7.46% loss. The next largest class type in 1966 was pasture and range land, occupying 11.78% of total area which fell to 9.23% in 1976 (Table 2).
According to the City of Edmonton, the population in 1966 was 381,230 (Edmonton). At that time, urban areas accounted for only 3.04% of the total area, which equated to 19,596 hectares (Table 2). In 1976 the population had grown to 461,559 and this growth was reflected in the land used in urban development (Edmonton). Urban built-up area increased 180.53% to 54,973 hectares and claimed 8.54% of the total study area (Table 2, Table 4). This was the most significant increase in a major land class. Outdoor recreational space saw an increase of
162.54% from 1,735 to 4,555 hectares and productive woodland grew 108.46% from 28,450 to 59,306 hectares (Table 4). This change was visibly noticeable as we can see regions of drastic change from undeveloped to developed land (Figure 1, Figure 2). In the case presented by figure 2, we can see where previously forested land was transformed into urban and recreational land in the form of a park. Another detail to take note of would be that urban built-up area seemed most commonly to be developed from pasture/range land (Figure 1).
From a landscape perspective, it is also interesting to note the shift from a more diverse landscape with a patch density of 1.32 and number of patches of 8,496 in 1966 to 8,287 patches in 1976 and a patch density of 1.29 (Table 1). Proportion of like adjacencies also increased slightly from 82.75% to 84.10% (Table 1). These metrics seem to indicate the landscape in 1976 was slightly more homogenous in nature with patches being larger in size but fewer in number. Further study is required to determine the merits and detriments of a compartmentalized system.
In conclusion, the Edmonton Metropolitan Area has seen noticeable change from the context of land-use from 1966 to 1976. Cropland remains the largest class type but has reduced over the study period. Urban built-up area holds a relatively small share of the landscape but is the fastest growing class. Land-use is shifting from a heterogeneous nature to larger areas being designated with a particular land-use. It is recommended that further study be conducted to determine the extent at which these changes will affect the landscape on local and regional scales.
Table 1: Changes in landscape metrics for land use in Edmonton Metropolitan Area between 1966 and 1976
| Year | Number of Patches | Patch Density | Total Edge | Proportion of Like Adjacencies |
| 1966 | 8496 | 1.3186 | 17331000 | 82.7487 |
| 1976 | 8287 | 1.287 | 15929100 | 84.0962 |
Table 2. Changes in class metrics for land use
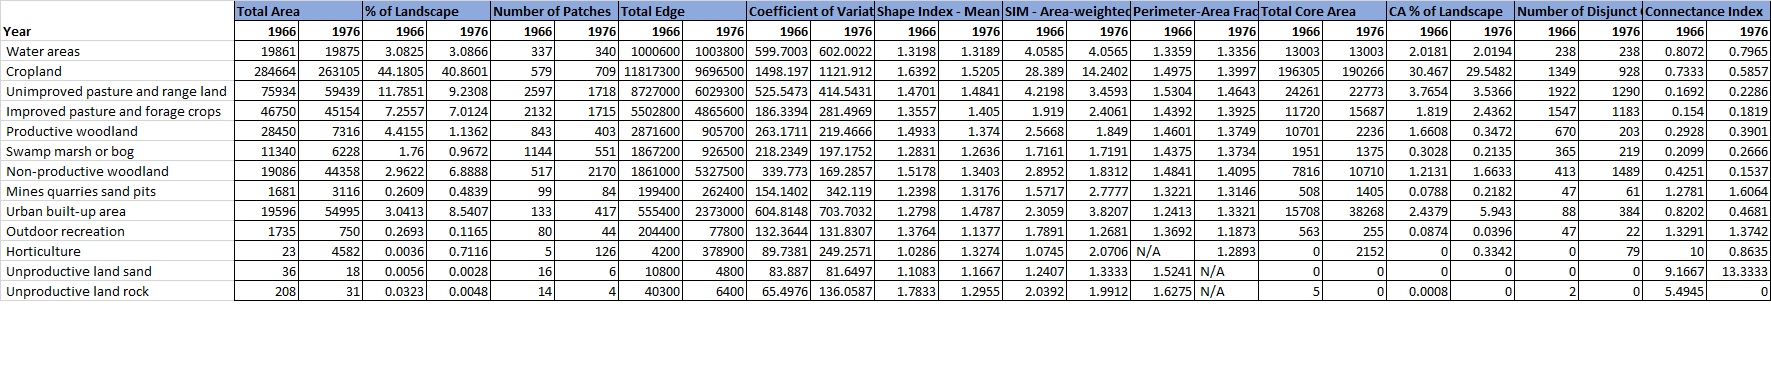
Table 3. Descriptions of the different metrics used in analysis
| Class Metrics | Measures used to calculate for different class types in the landscape (e.g. water areas, cropland, urban areas) |
| Total Area | Area of each class in hectares |
| % of Landscape | Percentage of each class as a total of the landscape |
| Number of Patches | Number of patches of each class type |
| Total Edge | Sum of perimeter length of all patches of a class type measured in metres |
| Coefficient of Variation of Patch Area |
Divides standard deviation of a patch size by the mean to indicate a measure of variability |
| Shape Index - Mean | Calculates patch perimeter divided by the root of a patch type's mean area |
| Shape Index - Area-weighted Mean |
Performs same function as Shape Index - Mean in addition to taking the patch type's proportional abundance into account |
| Perimeter-Area Fractal Dimension |
Measure of shape complexity through the regression of patch area and patch perimeter |
| Total Core Area | Sum of area of a class type that extends a given distances from the edge of the class type |
| Core Area Percent of Landscape |
Measures total core area of a patch type as a proportion of the total landscape area in hectares |
| Number of Disjunct Core Areas |
Count of disjunct cores of a class type which are core areas that are spatially contiguous |
| Connectance Index | Percentage used to measure functional joinings of a given class type as a proportion of all possible jointings |
| Landscape Metrics | Measures used to calculate for the full landscape |
| Total Edge | Sum of perimeter length of all edges in the landscape |
| Number of Patches | Count of total number of patches on the landscape |
| Patch Density | Ratio of patches in a landscape per 100 hectares of land |
| Proportion of Like Adjacencies | Percentage of like adjacencies of a class type against total cell adjacencies |
Table 4. Transition matrix presenting changes in land use between 1966 and 1976
| Landuse 1977 | ||||||||||||
| Landuse 1966 | Cropland | Horticulture | Improved pasture and forage crops | Mines quarries sand and gravel pits | Non-productive woodland | Outdoor recreation | Productive woodland | Swampmarsh or bog | Unimproved pasture and range land | Urban built-up area | Water areas | Grand Total |
| Cropland | 82.34% | 0.22% | 0.02% | 0.70% | 0.26% | 0.22% | 1.69% | 0.38% | 6.65% | 7.52% | 0.00% | 284295 |
| Horticulture | 34.78% | 52.17% | 0.00% | 0.00% | 0.00% | 4.35% | 0.00% | 0.00% | 0.00% | 8.70% | 0.00% | 23 |
| Improved pasture and forage crops | 0.98% | 0.01% | 94.40% | 0.13% | 0.28% | 0.09% | 0.77% | 0.16% | 2.15% | 1.02% | 0.00% | 46750 |
| Mines quarries sand and gravel pits | 4.34% | 0.00% | 0.12% | 42.59% | 3.81% | 5.35% | 9.10% | 0.18% | 13.44% | 21.06% | 0.00% | 1681 |
| Non-productive woodland | 12.57% | 0.05% | 0.05% | 0.27% | 8.53% | 2.30% | 51.62% | 0.46% | 13.32% | 10.85% | 0.00% | 19084 |
| Outdoor recreation | 0.17% | 0.00% | 0.00% | 0.00% | 0.00% | 85.42% | 0.00% | 0.00% | 0.29% | 14.12% | 0.00% | 1735 |
| Productive woodland | 14.92% | 0.04% | 0.11% | 0.39% | 1.44% | 2.07% | 63.76% | 0.27% | 7.33% | 9.67% | 0.00% | 28450 |
| Swampmarsh or bog | 17.67% | 0.04% | 0.12% | 0.07% | 7.82% | 1.04% | 12.86% | 28.17% | 26.08% | 6.06% | 0.08% | 11336 |
| Unimproved pasture and range land | 26.08% | 0.09% | 0.14% | 0.25% | 4.55% | 1.55% | 32.34% | 2.27% | 22.95% | 9.78% | 0.00% | 75896 |
| Urban built-up area | 0.02% | 0.00% | 0.01% | 0.01% | 0.00% | 0.00% | 0.01% | 0.00% | 0.00% | 99.96% | 0.00% | 19596 |
| Water areas | 0.00% | 0.00% | 0.00% | 0.00% | 0.00% | 0.00% | 0.00% | 0.00% | 0.00% | 0.00% | 100.00% | 19861 |
| Grand Total | 263086 | 750 | 44358 | 3116 | 7314 | 4555 | 59306 | 6224 | 45150 | 54973 | 19875 | |
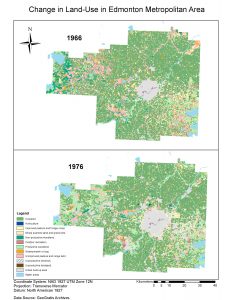
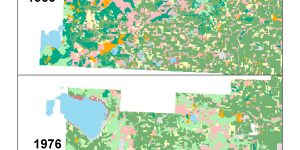
Figure 1. Map of land-use change in the Edmonton Metropolitan Area between 1966 and 1976
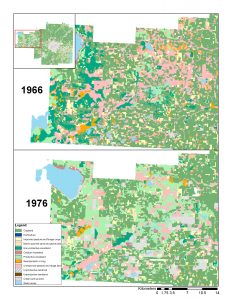
Figure 2. Map of land-use change in the Edmonton Metropolitan Area between 1966 and 1976
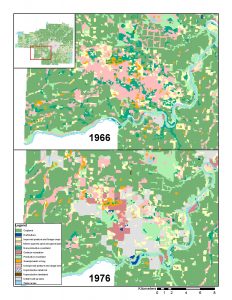
Figure 3. Map of land-use change in the Edmonton Metropolitan Area between 1966 and 1976