Vancouver is the largest metropolitan city in Western Canada. In 2006, the foreign born population accounted for 40% of Metro Vancouver’s total population (Metro Vancouver Census Bulletin #6). There has been a 200,000 person increase in the migrant population from 1996 to 2006, accounting for over half of the total population increase in Metro Vancouver (Metro Vancouver Census Bulletin #6). Immigrants are contributing immensely to Vancouver’s economic growth and have a considerable influence on its urban-scape. Supporting this claim, Metro Vancouver noted in their report that immigrants will play a key role in supporting Vancouver’s aging workforce. As a result, it becomes critical for urban planners to know where and how major migrant populations will move across Metro Vancouver.
Our project will examine how immigrants are distributed across Metro Vancouver. We are interested in two factors: how the various populations are spread out and if there are any correlations with income. Hoping to observe and generalize some trend in this globalized era, our project compares data from the most recent census - 2016, to the dawn of the 21st century – the 2001 census. According to the IRCC, the top 5 immigrant population by country of origin from 2005 through 2015 are (in order): Philippines, India, China, Iran, and Pakistan. These 5 ethnic groups account for nearly 50% of the total immigrants in 2015. We will create maps with pie charts to visualize the breakdown of these 5 major population across Metro Vancouver. In addition to the ethnic distribution, we will also be examining household income across Metro Vancouver and how that might be a manifestation of migrant status and different types of jobs in Metro Vancouver. Our project will come up with a total of 4 maps to display varying immigrant densities and income levels in 2001 and 2016.
Methodology
Acquire
Cartographic boundaries of census tracts (CTs) and dissemination areas (DAs) in Metro Vancouver for 2016 and 2001 were taken from the Abacus Dataverse Network. Tabular data on income and immigration data was collected from the University of Toronto’s Canadian Census Analyser tool. We focused on looking at median household incomes and took immigration data from the IRCC. Census data was sourced from StatsCan. For an easier viewing experience of our immigration data, we separated Metro Vancouver into its municipalities. In order to do this, we found the shapefile for municipal boundaries on Metro Vancouver’s public website.
Parse Filter
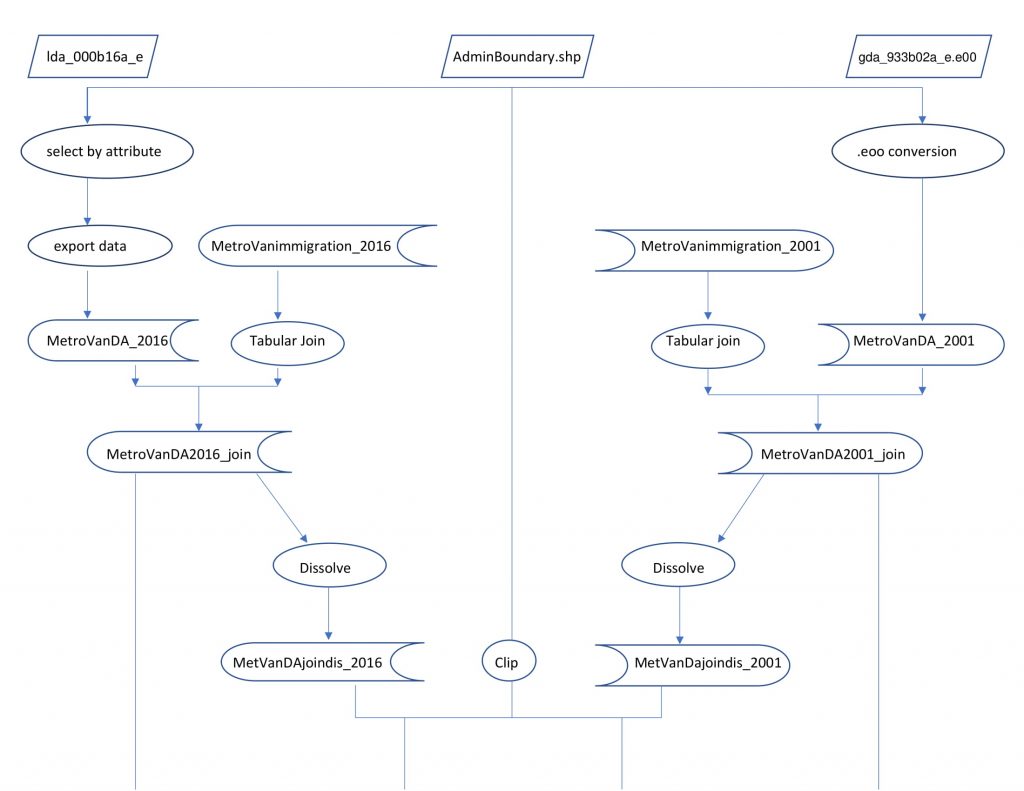
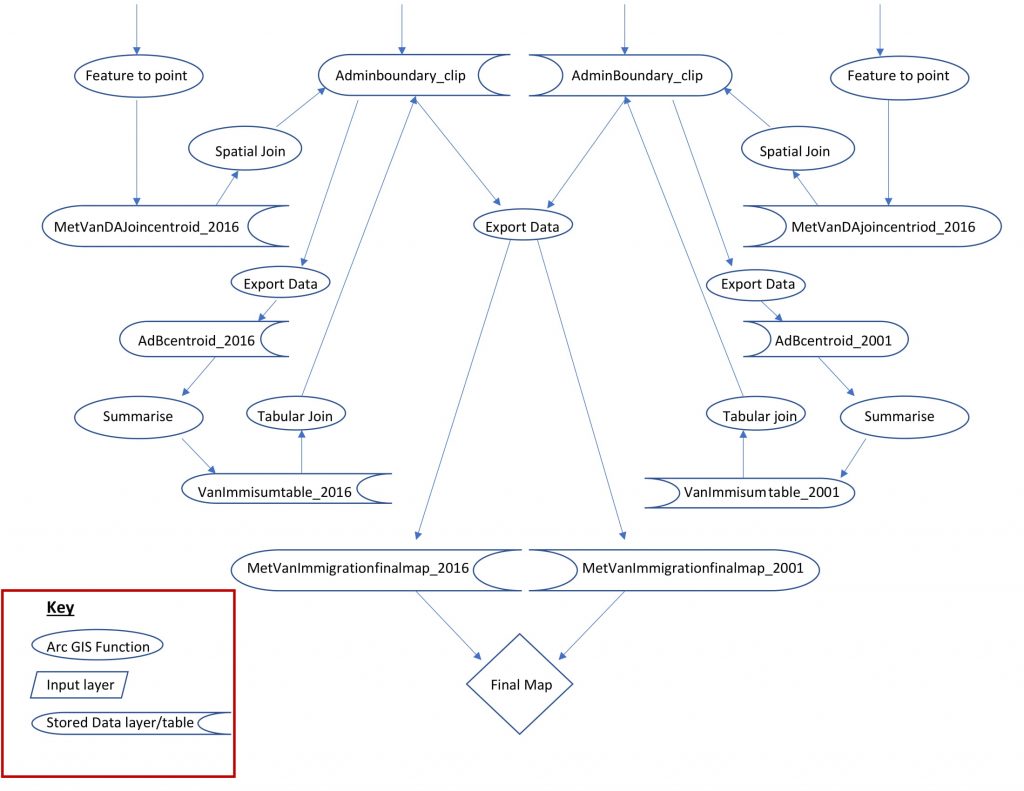
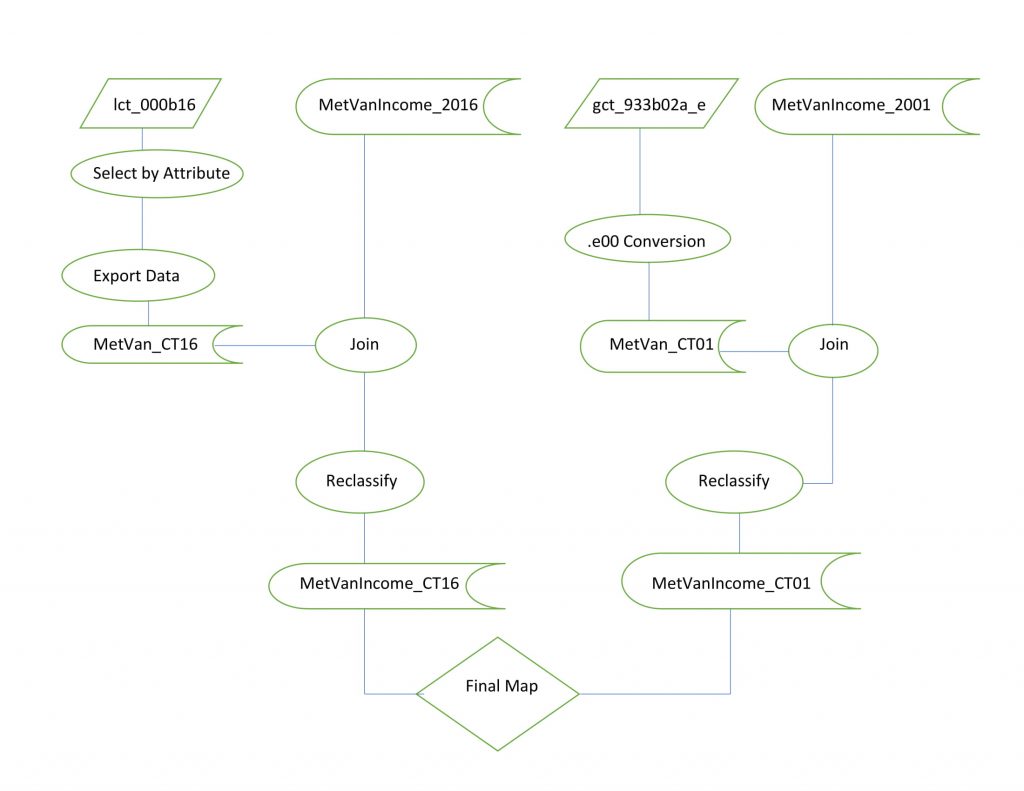
After collecting the tabular and vector data, the first step was to clip out the Metro Vancouver area from the 2016 cartographic boundaries, with the help of the ‘Select by Attribute’ function and exporting Vancouver CTs into a new layer. This step was not required for the 2001 maps as we were able to download just the CTs for Metro Vancouver, but we needed to convert the raw file from an older .e00 format into vector polygons. The rest of the process is identical for both income maps: the CT layers are joined with the tabular data for median household income and reclassified using manual breaks. Metro Vancouver was clipped out in the same way for the immigration map, except Dissemination Areas (DA’s) were used. After this step, we acquired the Administrative Boundaries of Metro Vancouver so that we could join the immigration data to it. In order to do this, we first needed to download the data tables that contained the population sizes of the five ethnicities we are studying, for both years. We joined these data tables with the DA’s and then clipped the Admin boundaries layer to the DA. We then got the centroid points of the DA’s and joined this to the clipped admin boundaries layer. We then summarised the population data, which gave us the total population of each ethnicity relative to the admin boundary. We then joined this to the clipped Admin boundary file and represented it through pie charts.
Mine
Our analysis consisted of three primary goals: comparing the change in income data between 2001 and 2016, analyzing the change in distribution of immigrant populations between 2001 and 2016, and examining any potential correlation between income and immigration. Since we summarised the total population of the five immigrant countries relative to the admin boundaries, we were able to compared this data for the two maps and saw some distinct changed. We compared the attribute tables for both years and could see the percentage increase or decrease for the ethnicities in different regions. We also compared the total population increase and decrease for each ethnicity in Metro Vancouver. For example, The Chinese population was 103,715 in 2001 and 197,450 in 2016, hence it increased by 93,735 people. We conducted similar calculations for the other ethnicities for our analysis.
Represent
The largest consideration that was taken into account was whether to use CTs or DAs for physical boundaries. We settled on CTs for income because we decided that they would give us the most representative data of the regions, and there would be fewer areas of data suppression, while we used DAs for our immigration maps because they allow for greater precision. For immigration, data suppression was not as large of an issue because we separated Metro Vancouver into its municipal boundaries and aggregated the data within the boundaries and displayed them in pie graphs. The decision to use pie graphs was made in order to create an easily understood visualization of the data and breakdown of ethnicities in each municipality. We selected the 5 largest immigrant ethnicities because we believed they would give us an effective approximation of immigrant population distribution. Using municipal boundaries rather than CTs or DAs allowed for a cleaner representation of our data and created a better general picture of ethnic distribution. We chose to use median household income over average because we wanted to avoid skewed averages in areas with large income disparities. We also chose to use the same manual data breaks for 2001 and 2016 in order to accurately portray the change that has occurred over the years. For this purpose, 2001 income data was adjusted for inflation into 2016 dollar values.
Table of datasets
| Layer / datafile name | Source | Uses | Entity/data model | Attributes | Modifications |
| Original and renamed | Agency, date compiled, data extracted | For example DEM to determine slope | Vector polygon/raster | Item names or general if big file with many columns | Changes: project, clip out project area, delete attributes. |
| Lct_000b16a_e (MetVan_CT16) | Abacus Dataverse, 28 March 2018, Canada Census Tracts 2016 | .shp to indicate data boundaries | Vector polygons | CTUIDS, Province, Metropolitan Area | Changes: extract Metro Vancouver from Canada into new layer |
| Gct_933b02a0 (MetVan_CT01) | Abacus Dataverse, 28 March 2018, Metro Vancouver CTs | .e00 indicating boundaries | Vector Polygons | CTUIDS, province, metro area | Changes: convert from .e00 to polygons |
| MetVanIncome_CT16 | CHASS, 28 March 2018, Median household income data 2016 | .dbf showing income in each CT | table | Median income, CTUIDs | Changes: joined with MetVan_CT16 |
| income01 | CHASS, 28 March 2018, median household income data 2001 | .dbf showing income in each CT | table | Median income, CTUIDS | Changes: joined with MetVan_CT01 |
| lda_000b16a_e
MetroVanDA_2016 |
Abacus Dataverse Network, 28th March 2018, MetroVancouver DA’s, 2016 | Shp to indicate boundaries. | Vector - Polygon | Province, metropolitan area
DAUIDS |
Exported metrovan from Canada’s DA’s to a new layer. |
| Gda_933b02a_e.e00
MetroVanDA_2001 |
Abacus Dataverse Network, 28th March 2018, MetroVancouver DA’s, 2001 | e00 indicating boundaries | Vector - polygon | Province, metropolitan area
DAUIDS |
convert from .e00 to polygons |
| AdminBoundary
MetroVanAdminB |
Metrovancouver.org, 2nd April, Admin Boundaries of MetroVancouver | Shp showing boundaries | Vector - polygon | Administrative boundaries of Metrovan | Clipped to MetroVanDA_2001 and 2016 |
| MetroVanImmigration_2016 | CHASS, 28th March 2018, total population of ethnicities in study by Admin boundary. | Dbf showing immigration data | Table | Table with DAUID and Filipino, Indian, Chinese, Iranian and pakistani population in 2016, In metrovan | Joined with MetrovanDA_2016 and AdminBoundary_clip |
| MetroVanImmigration_2001 | CHASS, 28th March 2018, total population of ethnicities in study by Admin boundary. | Dbf showing immigration data | Table | Table with DAUID and Filipino, Indian, CHinese, Iranian and pakistani population in 2001, in Metrovan | Joined with MetrovanDA_2001 and AdminBoundary_clip |
Discussion and Results
Background
One of the main contributing factors we found that likely caused a significant change in demographics between 2001 and 2016 was the 2001 Immigration and Refugee Protection Act (IRPA) which replaced the 1976 Immigration act. The act was a response to the September 11, 2001 attacks on the world trade center. Changes varied from the inclusion of same sex and common law relationships in the family class to the expansion of governmental powers to detain and deport landed immigrant suspected of being a security threat (Dirks, 2017). The act also promoted the successful integration of permanent residents into Canada and the entry of visitor’s students and temporary workers (Immigration and Refugee Protection Act, 2001). In many ways the act effectively made it easier for many people to immigrate who were unable to before, but later certain amendments were added which limited immigration in certain ways. In 2007, it was amended to allow the denial of a work visa to professions like exotic dancers under the premise that workers in these fields often face humiliating and degrading treatment including sexual exploitation.
We found that the IRPA increased the requirements for entrepreneur class immigrants creating a $50,000 minimum annual income and 5 years of business experience with a total corporate revenue of $500,000 (Trooper, 2017). It also specifically limited the number of immigrants from lower income statuses and increased priority given to workers with multiple skills. An analysis found that while the number of immigrants who move to prairie provinces has doubled in 2001 and 2016, the vast majority of immigrants choose major cities such as Vancouver and Toronto (Trooper, 2017). If immigrants are coming here for economic reasons, we can assume that the majority of them are relatively well off and skilled workers.
The IRPA also reformed the refugee system in a number of ways which likely influenced the flow of immigrants. Reforms included the expansion of who was defined as a protected person. In 2008, the IRPC was amended to create the “Canadian Experience Class” which increased the number of students and temporary workers who were able to apply for permanent residency.
Other more minor adjustments between 2001 and 2016 also likely contributed to the distribution of immigrants around Vancouver. Between 2000 and 2011, Temporary foreign workers more than tripled while the number of permanent residents has remained relatively constant. In 2012, the definition of who was a “skilled worker” changed reducing the number of jobs which qualified and added a language requirement and preferential treatment of those with better English skills, Canadian work experience, and those between the ages of 18 and 35 (Bragg, 2013). Graph 1 (Alboim, 2012) shows the change in motivation of immigration between 2002 and 2010.
Further, in 2010 the government introduced the Balanced Refugee Reform Act which created two classes of refugees; ones from “dangerous” countries which posed a risk to Canada and those from “safe” counties. Although some argue that the changes increased the speed at which claims were evaluated, others argue that preferential treatment of certain countries would allow admission into the country to be based on political whim rather than fair and independent decision (Dirks, 2017). None of the top 5 countries of origin which we analyzed in this paper are included on the list of “safe” countries meaning that claimants from those countries will experience a slower processing time (Citizenship Canada, 2017).
Data analysis
We could observe a suburbanization trend within Metro Vancouver between 2001 and 2016 in general. While the income level in downtown, East side, and Point Grey/UBC has dropped, the income has grown considerably in most suburbs such as West Vancouver, Coquitlam, Langley, and Maple Ridge. The median income level in Richmond, Burnaby, Delta, and North Vancouver remain stable.
There are two areas within the metro Vancouver that have noticeable drop of meridian income between 2001 and 2016. UBC and upper Richmond along Garden city road right by sky train. The reason why the income level might be lowered in point grey/UBC may be correlated to a growing student population. The income for University Endowment Land dropped $80,000(after adjusting for inflation) is around $44,000, this is a significant change. There might be changes in the way the data is defined and collected. The region Oak bridge along Garden city road in upper Richmond also provides interesting insights/ This area is a developing industrial and commercial zone, with several shopping malls established between 2001 and 2016. While one may expect the income to rise, the meridian household income dropped significantly. We suggest that this may be a result that people with higher income are relocating as a result of the commercialization and industrialization of this area.
In addition, the change of population composition is also a factor that contribute to median household income distribution. There is population in Canada is aging, and Vancouver is no exception. The affluent retired population may skew the income data. However, as Vancouver grows as a metropolitan city, more young people of high income and low income are also moving to the city. Housing several educational institutes, student population also has unneglectable influence.
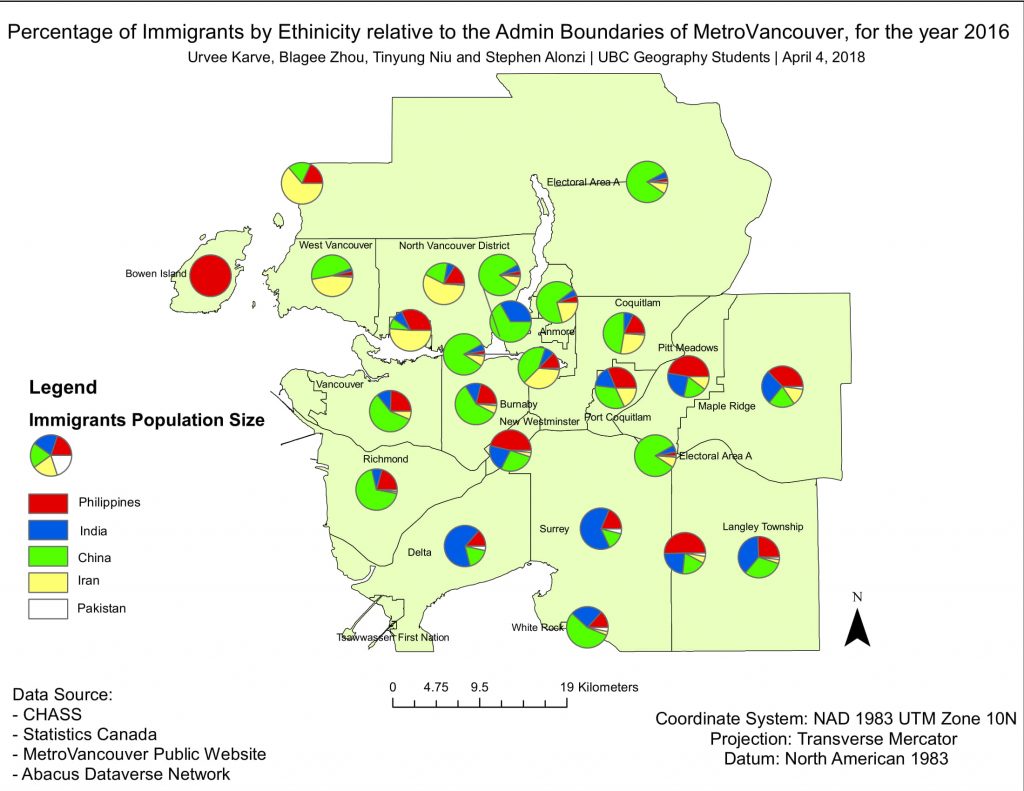
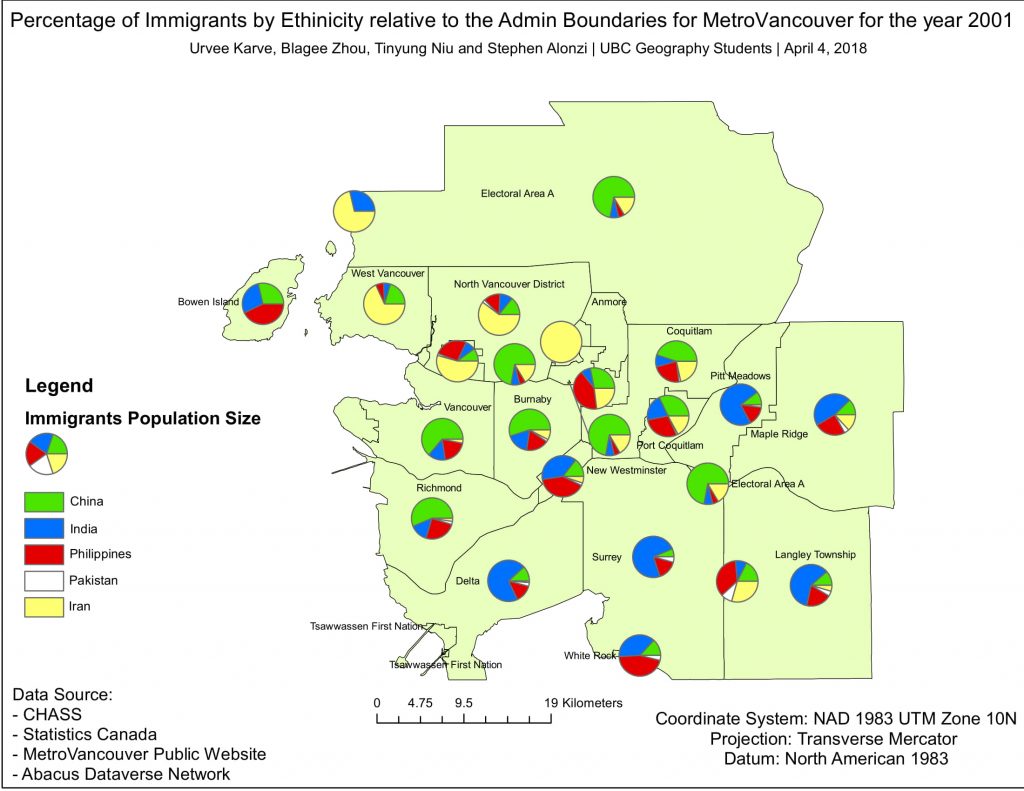
For migration pattern, we could observe that in general there is a bigger Indian immigrant population in the southern and eastern part of Metro Vancouver such as Delta, Surrey, Langley, and also Maple Ridge. The Iranian immigrants have the highest concentration in North and West Vancouver. In 2001, Chinese migrants accounted for the most of immigrant population in the city of Vancouver. One of the most notable changes is that between 2001 and 2016 is that the ratio of Chinese immigrants has grown significantly outside the city of Vancouver. Another prominent change is the increase of Filipino immigrants in the eastern part of metro Vancouver. In particular, Burnaby, Coquitlam, Maple Ridge, Langley, and interestingly, became the only ethnicity of the five migrant group on Bowen island. In other words, between 2001 and 2016, the most important change in migration pattern is that Chinese immigrants have become more spread out throughout Metro Vancouver. in addition, the ratio of Filipino migrants increased in eastern Metro Vancouver, and significantly on Bowen island. Indian immigrants remain primarily occupying southern Metro Vancouver, and Iranian primarily northern Metro Vancouver.
The most notable income increase can be observed in Maple Ridge, Langley, Coquitlam, West Vancouver. In these districts, there is increased percentage of Chinese and Filipino immigrant population. In Richmond, North Vancouver, and Delta there is no distinctive change in income level. Interestingly, the ratio of the migrant groups also did not have noticeable change. Downtown, east Vancouver, Burnaby, and Point Grey saw a decrease in income level, Chinese is the majority of migrant group both 2001 and 2016 in these districts.
Historically, people tend to migrate to places where there is already a group of their own ethnicity. We can see this clearly in the 2001 and 2016 immigration maps mostly in Indian immigrant populations and Chinese Immigrant populations. For example, the Chinese were amongst some of the first immigrants to migrate to Vancouver and settled in the historic Chinatown district and in looking at recent years, although we did not look specifically at Chinatown, the electoral district which it falls into continues to have a large portion of Chinese immigrants. Further, many of the areas in the 2001 map which had more than half or a significant portion of a given ethnicity found similar or greater portions of the same ethnicity in 2016. For example, Delta and Surrey had a majority of Indian immigrants in 2001 and in 2016, this majority only increased. In addition to migrating towards similar ethnicity, people tend to migrate towards similar levels of urban development meaning people from cities tend to move to larger cities within the metro area and people from more rural parts tend to move towards more rural areas such as Surry or Delta.
Another factor related to income and migration pattern is the time immigrants have lived in Canada. Some immigrants come to Vancouver with less disposable income and as a result tend to migrate to more affordable parts of Vancouver, this is particularly true prior to the policy reformation on the skilled worker and business migration. These immigrants could increase their wealth over time and are able to move to more expensive areas of Vancouver. For example, we find a larger number of Chinese immigrants in higher income areas in our migration maps partially because they have had the most consistent historical migration patterns stemming from the late 1800s. Over time, some Chinese immigrants were likely able to accumulate money and relocate to wealthier areas. This relocation in turn encourages more immigration directly from China to these areas.
From our data it was hard to find any other correlations between income and ethnic distribution. We realized that people immigrate to Canada for many different reasons and from many different socioeconomic levels. Further, their distribution throughout Metro Vancouver could be the result of many other factors beyond the scope of our project.
Error and Uncertainty
Some notable errors and uncertainty arise from data selection. More precisely, how and why we chose to use these five countries and what that may entail. Since it would be visually confusing to include all ethnicities that have migrated to Metro Vancouver, we decided to use the top 5 countries by immigrant number. While this decision benefits map visualization, it omits a lot of data and presents unintended bias. In addition, the top 5 country of immigrant’s ethnic origin we found through Immigration, Refugees, and Citizenship Canada pertains to the entire country rather than exclusively Metro Vancouver. This is why despite Pakistan is the 5th largest ethnicity to come to Canada, we see very few of them in our maps. Furthermore, we were only able to find the demographic data for “immigrants” from Statistic Canada, although people who are temporary worker or hold a Permanent Residency are also important variables to look at. The immigration pathway to Canada is another critical piece of data that we were not able to find from the data source. These factors are important in terms of analyzing immigration and its correlation to income change.
In addition, our income data includes all population of Metro Vancouver, we were not able to find data for exclusively migrant household income. This becomes a confusing factor when we were analyzing the correlation of immigration with the income data since the ratio of immigrant and non-immigrant differ across all census tract areas.
Initially, we intended to compare the change between 1996 to 2016 to observe change over two decades. Unfortunately, the 1996 map and 2016 map uses different datum. To combat this problem, we switched to comparing 2001 and 2016 which uses the same datum (NAD 73).
There is also error that comes from the data that we got. For example, the abrupt change of household income value in UBC (University Endowment Land) which dropped by nearly half (80,000 to 44,000) between 2001 and 2016, may be influenced by other factors. Perhaps the delineation of this area changed, or perhaps by the significant increase in student housing on campus during this period. Additionally, in the 2001 map, the water body from Vancouver harbour to Indian Arm were displayed as a part of the electoral districts. Lastly, the usage of dissemination area for our immigration maps entails data suppression.
Furthermore, there are types of error to be considered for all mapping processes on GIS. For example, census data in general has some level of inherent error mainly coverage, non-response, response, sampling, and processing errors (Dirks , 2017). The omitted data due to erroneous responses is left blank in our maps (income maps). Another type of error occurs during the entry and conversion process in Arc GIS. These errors mainly occur when data is converted from one form to another or when they are joined together. There is likely a small amount of error which occurs during the process of database entry and its journey from raw data to finalized data from soft and hardware faults. A small amount of error likely occurred in the conversion of the 2001 arcinfo interchange (.e00) files to shapefiles. Further, during every step in which the data is transformed, a small amount of computational error have potentially occurred (Dirks, 2017).
Further Research and Recommendations
Given the limitations and errors of our research, there are two factors that would be required for future research. Firstly, relevant to our immigration map, it would be more meaningful to create maps using major ethnic origin in Vancouver. Secondly, it would be critical to analyze income data exclusively of immigrants rather than all Vancouver residents. Alternatively, future research could also compare the difference in income between immigrants and native citizens. Furthermore, this type of research which links immigration pattern and income could be expanded to a larger scale such as all of British Columbia or shift focus to a different city. There may also be interesting findings from comparing rural to urban areas.
For any map representing immigration pattern according to ethnic background, the selection of data and the method of display should always be seriously considered for map production, since the data could not be presented in a simple visualization give how much variability there are concerning the definition of immigrants as well as the vast pool of source countries.
Appendices
![]()
Works Cited
Alboim, N., & Cohl, K. (2012, October). Shaping the future: Canada’s rapidly changing
immigration policies. Retrieved from https://maytree.com/wp-content/uploads/shaping-the-future.pdf
Bank of Canada. (n.d.). Inflation Calculator. Retrieved from
https://www.bankofcanada.ca/rates/related/inflation-calculator/
Bragg, B. (2013, February). A Guide to Canada’s Changing Immigration Policy. Retrieved
From http://www.ecccalgary.com/wp-content/uploads/Immigrati
on_Policy_Guide_06-13.pdf
Canada, Immigration Refugees and Citizenship Canada. (2015). Permanent Residents by
Source Country.
Census of Canada, 2001. Median Household Income (Metro Vancouver, Tabular)
Census of Canada, 2001. Cartographic Boundary Files (Metro Vancouver, Vector)
Census of Canada, 2016. Median Household Income (Metro Vancouver, Tabular)
Census of Canada, 2016. Cartographic Boundary Files (Metro Vancouver, Vector)
Citizenship Canada. (2017, April 03). Designated countries of origin policy. Retrieved from
https://www.canada.ca/en/immigration-refugees-citizenship/services/refugees/claim-
rotection-inside-canada/apply/designated-countries-policy.html
Dirks, G. E. (2017, June 26). Immigration Policy in Canada. Retrieved from
http://www.thecanadianencyclopedia.ca/en/article/immigration-policy/
Immigration and Refugee Protection Act (2001, c. C-27). Retrieved from Justice Laws
website: http://laws.justice.gc.ca/eng/acts/i-2.5/page-1.html#h-1
Metro Vancouver. (2008). 2006 Census Bulletin #6 Immigration and Cultural Diversity.
Retrieved from http://www.metrovancouver.org/services/regional-planning/
PlanningPublications/Census2006_Immigration_Bulletin_6.pdf
Troper, H. (2017, September 19). Immigration in Canada. Retrieved from
http://www.thecanadianencyclopedia.ca/en/article/immigration/#h3_jump_8
Learning Significance