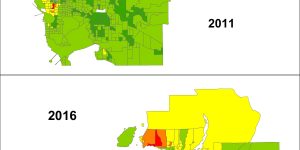
The following map represents the median costs of dwellings in Metro Vancouver. The data is taken from different census reports that are publicly available from Statistics Canada. Another common metric used to measure housing affordability is shelter cost, which is defined as being the average monthly sum of all living expenses, including mortgages, rental payments, property taxes, and utilities. The issue with this form of measurement is that it is very volatile and inconsistent. Every household will have different costs that vary from month to month. This instability makes for unreliable data and is not as effective for the purpose of this project as something like property value.
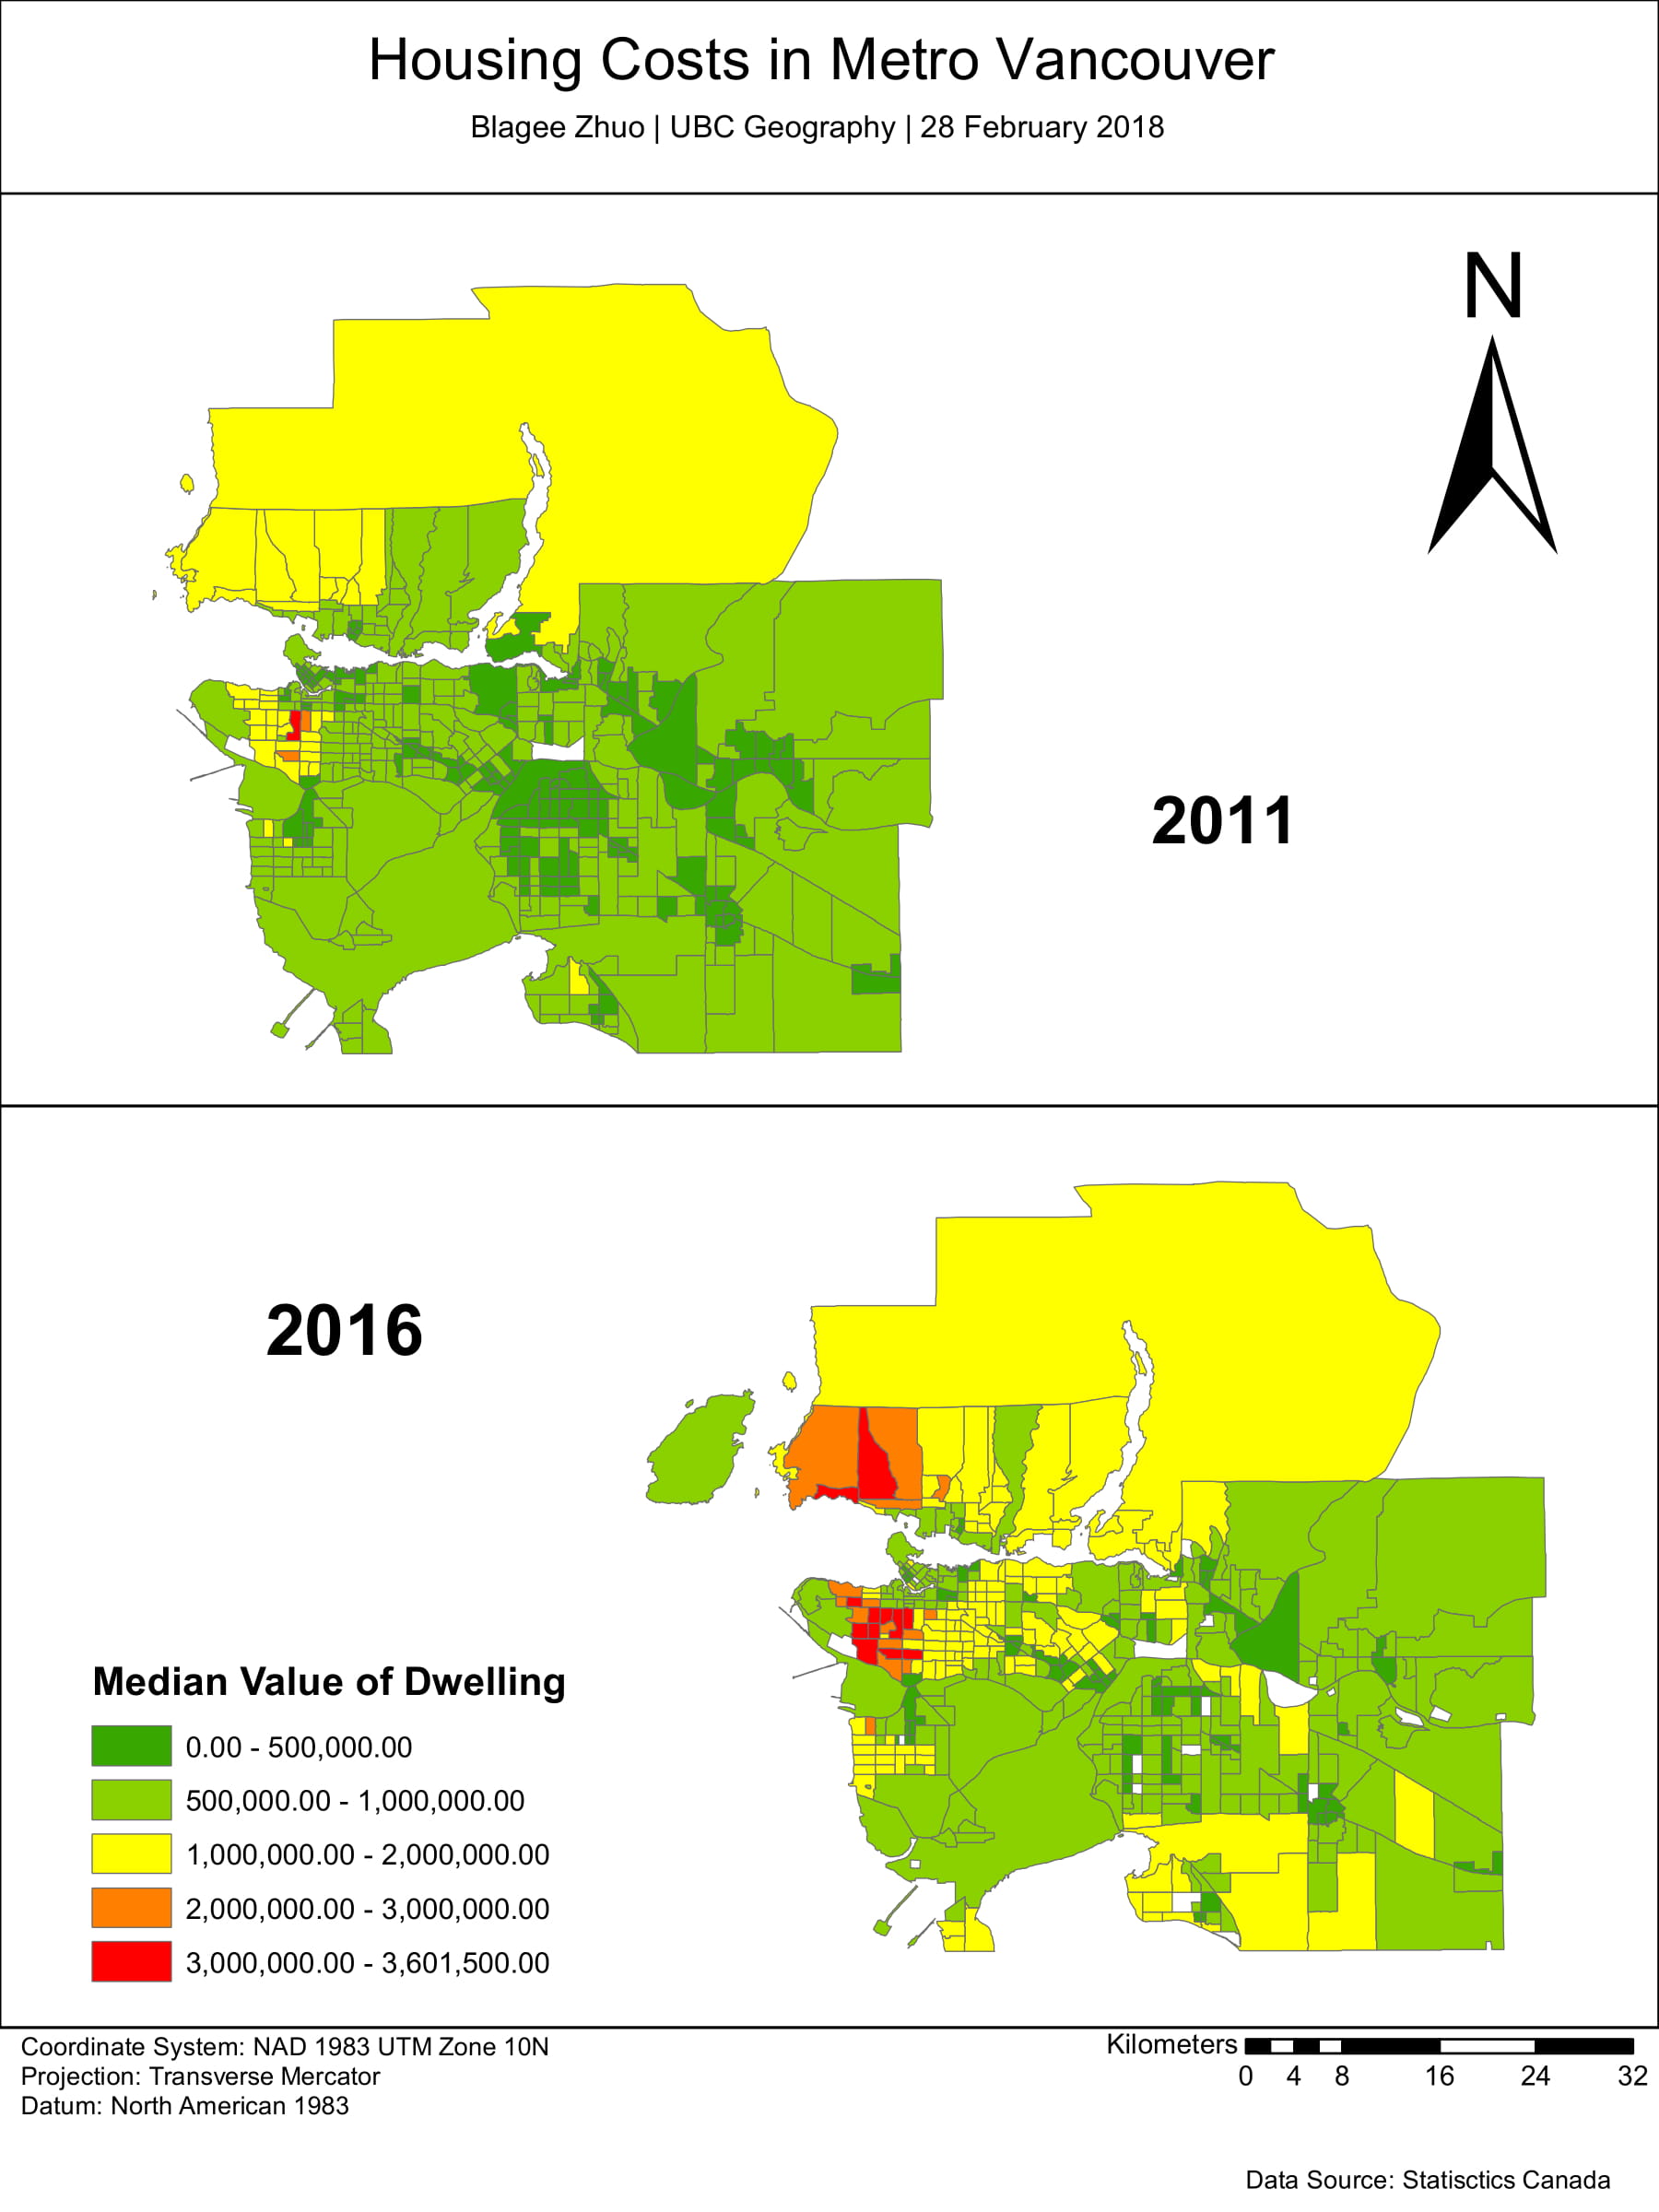
Collected data from external sources and used knowledge of classification to present an accurate portrayal of Vancouver housing costs.